
ALMA Data Reduction: AS2UDS Problems
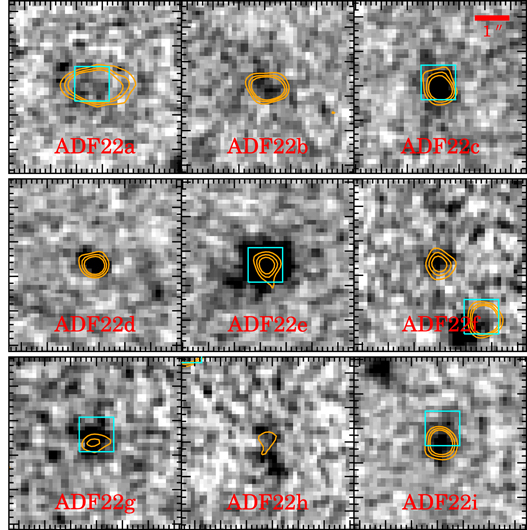
ALMA results from Umehata et al., 2015, ApJ, 815, L8.
This page provides a guide to modified CASA scripts needed to calibrate and image a set of observations. A number of values have been removed to allow you to set parameters as you choose. If you really get stuck, the script directory also contains gzipped versions of the full script (apart from some final post-imaging stages) but don't use these if you want to learn for yourself; it is much better to discuss issues you are stuck on and experiment with different values.
A companion page gives a basic introduction to a similar script, which you should work through first if you are a beginner. It also explains the preliminary steps from downloading the archive data.
Getting started
Go to the directory for the other data set (not the one used for the first script).
cd Durham/AS2UDS/2012.1.00090.S/science_goal.uid___A002_X5eed86_X29/group.uid___A002_X5eed86_X2a/member.uid___A002_X5eed86_X2b/
emacs README &
This describes what is in the data delivery and how to re-create the calibrated data. Now go straight to the data directory.
cd raw
ls
ls ../script
emacs ../script/uid___A002_X7143f6_Xf9b.ms._MOD_scriptForCalibration.py &
Instrumental calibration
Convert data to MS format, list contents of MS, apply initial flags
Start CASA in the current director and execute steps [0, 1, 2, 3] as you did before, i.e.
# In CASA:
mysteps=[0, 1, 2, 3]
execfile('../script/uid___A002_X7143f6_Xf9b.ms._MOD_scriptForCalibration.py')
This should give you the .listobs file.
Water Vapour Radiometry corrections
Look at the script uid___A002_X7143f6_Xf9b.ms._MOD_scriptForCalibration.py and insert the missing values (you can find a list of targets near the start of the script). Then execute step [4] and inspect the diagnostic plots uid___A002_X7143f6_Xf9b.ms.wvr.smooth.plots/*png and the text file uid___A002_X7143f6_Xf9b.ms.wvrgcal. Do you think that any of the antennas have bad wvr values?
Tsys corrections
Execute step [5] and inspect the diagnostic plots uid___A002_X7143f6_Xf9b.ms.tsys.plots.overlayTime/*png (check the Tsys values as well as the shape). One of the antennas has anomalous values; check the data themselves by filling in the missing parameters and running plotms:
# In CASA:
default plotms
vis ='**'
field='**'
spw ='9:10~120,11:10~120,13:10~120,15:10~120'
xaxis='frequency'
yaxis='amp'
antenna='DA44&DA*'    # Plot a selection of baselines to refant
coloraxis='antenna2'
avgtime='3600s'

inp

plotms     # when you have filled in all the parameters you need
To me, it looked like all the data themselves were consistent so you can use a utility to copy the Tsys from a nearby antenna to replace the bad values. Use plotants to identify a nearby antenna. Look at the .listobs to see the numbers of the first and last scans; these are 0 and 100, and we use the python function range to create an array for the scan numbers. In the script uid___A002_X7143f6_Xf9b.ms._MOD_scriptForCalibration.py, you will see the following lines commented out:
#  caltable='**'
#  fromAntenna='**'
#  toAntenna='**'
#  scs=range(0,101)
#  aU.copyTsys(calTable, fromAntenna, toAntenna, spw=[9,11,13,15, scans=scs)
Enter the values and remove the comment characters # and re-run this Step. Check the plots again and all the Tsys should be consistently around 100-200 K.
Apply instrumental corrections, split out, list and inspect the corrected data
Including deriving the empty antenna position table...
Execute steps [6, 7, 8, 9]
Use plotants to check whether DA44 is still in the array to use as the reference antenna. Now inspect the data:
# In CASA:
plotms(vis='uid___A002_X7143f6_Xf9b.ms.split',
	field='0',     # the bandpass calibrator, see listobs output
	xaxis='channel', yaxis='amp',
        spw='0:7~120,1:7~120,2:7~120,3:7~120',
	antenna='DA44&*', # plot all baselines to refant
	coloraxis='baseline',
	avgtime = '3000s')
Use Mark Regions and Locate to identify which antenna is giving bad data. Change the x-axis to UVwave and re-plot. This shows the difference between data which are really bad and data which are just a bit de-correlated due to being on the longest baseline to the refant. Fill in a flag command in Step [10] and execute this step.
Calibration using astrophysical calibration sources
Set flux standard
Look at listobs to identify the flux scale standard source, the date of observation and a reference frequency (it does not matter whether this is in channel 0 or the middle as long as it is specified consistently). Set these and use the utility to find the flux density at the time of observations.
# In CASA:
CALIBRATE_FLUX='**'
REFFREQ='**'
REFDATE='**'
aU.getALMAFlux(CALIBRATE_FLUX, REFFREQ, date=REFDATE)
Now look at the script uid___A002_X7143f6_Xf9b.ms._MOD_scriptForCalibration.py, step [11]. The output of aU.getALMAFlux is a Python dictionary which is passed to a variable so that the required values are passed to setjy. Fill in the name of the flux standard etc. and execute step [11] - check in the logger that the values set are what you expect.
Bandpass calibration
Execute steps [12, 13] and check that the plots are reasonable, especially the antenna whose Tsys you corrected.
Time-dependent calibration of phase and amplitude
Execute steps [14, 15] and check that the plots are reasonable, and the .fluxscale output gives sensible values (compare any sources in common with the previous data set).
Apply calibration and split out the corrected data
Execute steps [16, 17] and check the calibrated data as you did before in plotms. When plotting against UVwave, note the maximum uv distance and the distance before the big gap, as before.
Imaging the targets
First imaging of each field
# In CASA:
!emacs ../script/scriptForImaging_MOD.py &
For Step [1], work out the appropriate cell size and image size and enter the variables, and then:
# In CASA:
mysteps=[1]
execfile('../script/scriptForImaging_MOD.py')
When it's finished, examine the images in the viewer, as before. This time, there are several sources with no apparent detection. Note their numbers. Also note which image seems to have the brightest peak/best S/N.
Look at scriptForImaging_MOD.py step [2]. Insert the required values for the source numbers to try a tapered beam and a bigger image for the non-detections. This time, you will clean interactively. Check the images for detections. If time, you could try other variations.
Self-calibration
The brightest source seems to be 11, so we might be able to self-calibrate. Check that its model is still in the data (if not, we could insert it using ft).
# In CASA:
plotms(vis = 'uid___A002_X7143f6_Xf9b.ms.split.cal',
       ydatacolumn='model',
       xaxis='uvwave', yaxis='amp', field='11',
       avgchannel='128')
Have a go at calibration manually, to test for the best settings
# In CASA:
os.system('rm -rf uid___A002_X7143f6_Xf9b.source11.p1')
default(gaincal)
vis = 'uid___A002_X7143f6_Xf9b.ms.split.cal'       # input data set
caltable='uid___A002_X7143f6_Xf9b.source11.p1'     # suitable name for output table
field='**'                                         # select target
refant='**'                                        # as before
calmode='p'                                        # phase only

inp
You will see that the defaults are :
solint  ='inf'
combine =''
gaintype='G'
This means, average in time up to scan boundaries; do not average polarizations (correlations).
Run gaincal. You will probably see that a very high proportion of solutions fail in all timeslots. We can try averaging to improve the S/N. The bandpass and phase reference calibration should have removed offsets between spw and between polarizations, so now try:
# In CASA:
os.system('rm -rf uid___A002_X7143f6_Xf9b.source11.p1')
default(gaincal)
vis = 'uid___A002_X7143f6_Xf9b.ms.split.cal'       # input data set
caltable='uid___A002_X7143f6_Xf9b.source11.p1'     # suitable name for output table
field='**'                                         # select target
refant='**'                                        # as before
calmode='p'                                        # phase only
solint  ='inf',                                    # average up to scan boundary
combine='spw'                                      # combine spectral windows
gaintype='T'                                       #combine polarizations

inp

gaincal()
You should now see that only a few solutions fail. Plot the solutions.
# In CASA:
 plotcal(caltable='uid___A002_X7143f6_Xf9b.source11.p1',
        xaxis='time',yaxis='phase',
        subplot=441,
        iteration='antenna')
You should see that they have a scatter of about 30 deg, which suggests that they are worthwhile but not pure noise. Enter the appropriate values in the script step [2] (but there should be no need to re-run it; however, if you do, exit the plotter first).
Apply self-cal solutions and re-image
Look at Step [3] and fill in the cell size and the image size. Look at the inputs to applycal
spwmap=[0,0,0,0]
Use spwmap=[0,0,0,0], which means, apply the solutions labelled spw 0 in the solution table to all 4 data spw; because we averaged all spw, the solution table only contains a single frequency solution labelled spw 0.
Check all the inputs and execute step [3].
Inspect the image created in the viewer; compare it with the previous image of that source.
Statistics; primary beam correction; export as fits.
If you have time, write loops to measure the (un-corrected) peak and rms in all images and estimate the S/N. Then apply the primary beam correction, measure the corrected peak flux densities and export the images as fits files.